
Demographics

Highlights
In 2023, 1,059,000 people lived in Nova Scotia, an increase of 3.2% from 2022 to 2023. Nova Scotia represents 2.6% of Canada's total population.
The average age of the Indigenous population in Nova Scotia was 37.0 in 2021 compared to 44.2 for the non-Indigenous population.
- The proportion of seniors aged 65+ is projected to increase from 22.1% in 2023 to 26.3% in 2033.
- In 2023, individuals aged 55 and over accounted for 36.6%of the working-age population. Over the next decade, this proportion is projected to reach 38.0%.
- The proportion of youth (ages 15 to 29) is projected to decline from 18.4% in 2023 to 16.9% in 2033.
- Enrolment in the K-12 school system has been growing since the 2016/17 school year and has reached its highest student population since 2008/09 with a total of 131,343 students in 2023/24.
The number of employed immigrants in Nova Scotia reached a historic high of 74,000 in 2023. This was up by 21.5% a year earlier. Almost 15% of employment in Nova Scotia during 2023 was comprised of immigrants, more than doubling the 6.6% share observed a decade ago.
Due to record growth in immigration, Nova Scotia has seen a greater linguistic diversity for the region as more immigrants speaking non-official languages as their mother tongue landed in the region. In 2021, there were 93,440 people in Nova Scotia who had knowledge of non-official languages with Arabic (13%), Hindi (11%), Spanish (9%) being the most common.
Nova Scotia remains a largely Anglophone province as 89.3% of the population only knew English while 10.3% had knowledge of both official languages in 2021. Three communities with Acadian roots; Argyle (56.7%), Clare (68.5%), and Richmond County (55.7%) had the highest prevalence of bilingualism with rates above 50%.
Nova Scotia has a unique demography where certain minority groups have a high commonality. In 2021, the province had the highest prevalence of transgender persons in Canada at a rate of 2.2 per 1,000 people. Its largest Census Metropolitan Area, Halifax, had the highest rate geographically at 3.3 per 1,000 people in 2021. Further, in 2017 the province had the highest rate of persons with disabilities in Canada during 2017 at a rate of 30.4%. In 2021, people with disabilities earned an average of $31,700 annually, over 33.4% less than their counterparts which earned $43,300.
Labour Market Conditions
In 2023...
Employment rose strongly (2.7%)
Unemployment declined moderately (-0.6%)
Participation rate fell slightly (61.7% to 61.5%)
Employment rate was mostly unchanged (57.7% to 57.6%)
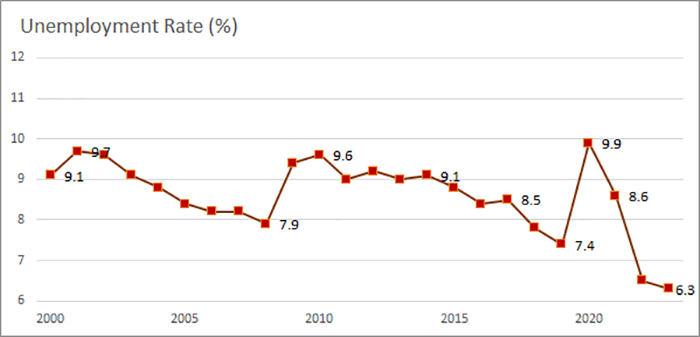
Province's Unemployment Rate
Show data table: Province's Unemployment Rate
| Unemployment Rate (%) | |
|---|---|
| 2000 | 9.1 |
| 2001 | 9.7 |
| 2002 | 9.6 |
| 2003 | 9.1 |
| 2004 | 8.8 |
| 2005 | 8.4 |
| 2006 | 8.2 |
| 2007 | 8.2 |
| 2008 | 7.9 |
| 2009 | 9.4 |
| 2010 | 9.6 |
| 2011 | 9.0 |
| 2012 | 9.2 |
| 2013 | 9.0 |
| 2014 | 9.1 |
| 2015 | 8.8 |
| 2016 | 8.4 |
| 2017 | 8.5 |
| 2018 | 7.8 |
| 2019 | 7.4 |
| 2021 | 9.9 |
| 2021 | 8.6 |
| 2022 | 6.5 |
| 2023 | 6.3 |
- Employment in Nova Scotia grew to a record high of 497,800 in 2023 and the unemployment rate reached its lowest since 1970. Population growth in the province outpaced strong gains in employment causing the employment rate to fall slightly to 57.6%.
- Employment is forecasted to slowdown marginally in the next couple years but remaining strong at 1.5% in 2024 and 1.9% in 2025. The unemployment rate is expected to rise back to pre-pandemic levels as slower employment growth is outpaced by a growing labour supply.
- Labour market conditions have started to loosen during the later half of 2023 (2.0 - 2.5) having reached a record low in November 2022 of 1.2 job seekers per available position.
Economic Conditions
Nova Scotia's Economic Drivers in 2023
Rapid population growth
Increased household consumption
High inflation and interest rates
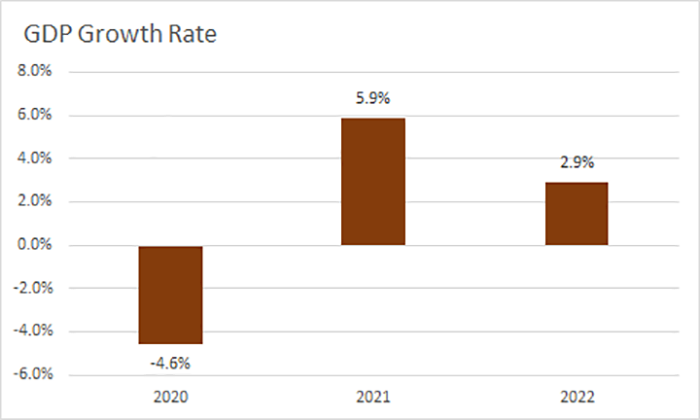
Show data table: GDP Growth Rate in Province
| Year | GDP growth rate |
|---|---|
| 2020 | -4.6% |
| 2021 | 5.9% |
| 2022 | 2.9% |
- The Nova Scotia economy continued to grow by 2.9% in 2022, following a rebound of 5.9% in 2021 during the post-pandemic recovery. Per capita output was up slightly (+0.5%) to about a third lower than the national average. Output in 2023 is expected to have slowed to 1.3% as the economy normalizes and will begin to rise to 1.7% in 2024 while inflationary pressures wane.
- After reaching a milestone of one million in 2022, population has continued to grow at rapid pace in Nova Scotia. There were 1,058,694 living in the province in 2023, a 3.2% increase compared to 2022. Those in the prime working age demographic (25 to 45 years) accounted for 58.4% of this growth driving the median age down to 43.8 (-0.7pp). The influx of population has partly contributed to the growth in household consumption which is forecasted to be up by 5.8% annually in 2023.
- Both inflation and interest rates started off high in 2023 for Nova Scotia at 6.9%and 4.25% respectively. Throughout the year inflation fluctuated, having dipped to 1.9% in June, rebounding to 4.8% in September, and ending the year at 3.6%. Interest rates were raised on three occurrences rising to 5.00% by 2024.
Risks to the Nova Scotia Economy in 2024
- Global conflicts in the Middle East and Eastern Europe could drive the number of refugees inbound to the province potentially creating further pressures on housing and public services. Moreover, commodity prices, especially for oil, could remain high or rise further, and conflict escalation could impact international trade for the province.
- Nova Scotia experienced severe wildfires, flash flooding, and hurricane conditions in 2023. These extreme weather events are expected to become more common and could further impact public budgets through infrastructure damage, reduction in the housing supply, and delay capital projects.
Regional Issues
- With the unprecedented population boom in Nova Scotia in recent years, the region has been undergoing some growing pains trying to keep up with market pressures. Demand for public services such as healthcare, and education has surged and finding labour to fill occupations such as nurses, doctors, early childhood educators, and public school teachers has been a struggle for employers province wide. In response, new policies trying to recruit and retain skilled labour in the province such as reducing job requirements, international recruitment, and improving compensation to help grow labour supply in these markets have been introduced in recent years.
- Although inflation has tapered off from its peak in 2022, consumers in Nova Scotia are facing challenges trying to afford food and other essentials. Housing has become less affordable or difficult to find in recent years and supply has been struggling to keep up with demand. In 2023, the Halifax Regional Municipality (HRM) saw homelessness grow by 49.7% year-over-year to 1,066 individuals. Several housing developments and homeless projects are progressing; however, the lack of housing make it difficult to hire prospective workers from outside the province. On a more positive note, residential investment is expected to grow significantly in 2024 by 5.1% and inflation is projected to be within the Bank of Canada's target range at 1.9% in 2025.
Industry Trends
Show data table
| Industry (NAICS) | Employment Change ('000s) |
|---|---|
| Wholesale and retail trade | 4.7 |
| Information, culture and recreation | 3.6 |
| Other services (except puplic administration) | 3.0 |
| Accommodation and food services | 2.3 |
| Public administration | 2.1 |
| Finance, insurance, real estate, rental and leasing | 2.1 |
| Educational services | 1.8 |
| Transportation and warehousing | 1.3 |
| Manufacturing | 1.0 |
| Professional, scientific and technical services | 0.8 |
| Agriculture | 0.2 |
| Forestry, fishing, mining, quarrying, oil and gas | -0.5 |
| Utilities | -1.3 |
| Business, building and other support services | -1.5 |
| Health care and social assistance | -2.6 |
| Construction | -4.0 |
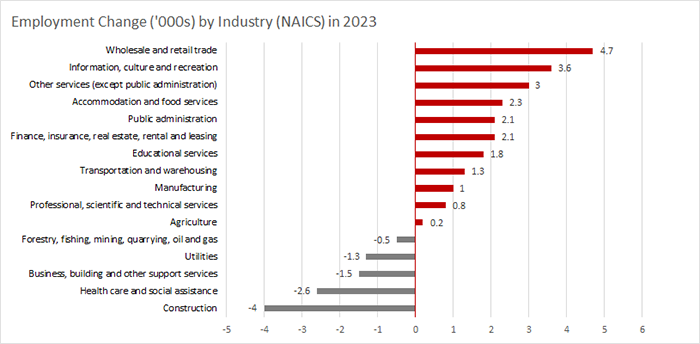
- All employment gains in 2023 were in the services-producing sector (+17,400) while all good-producing industries (-4,600) except manufacturing (+1,000) saw declines year-over-year. The composition of the labour market in Nova Scotia continues to be primarily service driven as 81.6% of all employment were in the service-industries (+1.4pp).
- High contact industries such as wholesale and retail trade (+4,700) and information, culture and recreation (+3,600) had the largest job growth showing further recovery from some of the hardest hit industries during the pandemic. Tourism in 2023 was still 7% below pre-pandemic levels in 2019, leaving more potential for these industries to grow further.
- The construction industry saw the greatest decline in employment losing 4,000 jobs in 2023. This is stark contrast to the year previous when it it had the strongest job gains totalling 6,500 in 2022. Although the demand for housing and capital spending remains strong in the province, recruitment for labour in the skilled trades remains a challenge for employers and is a high priority for government policies. Projections remain strong for this industry with a 4.0% growth rate in output expected for 2023-2025.
Regional Economic Conditions
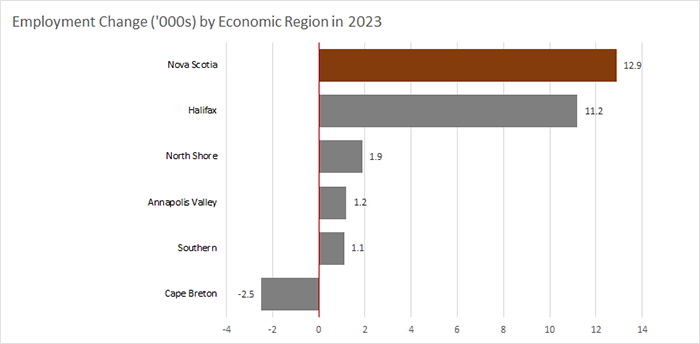
- All economic regions in Nova Scotia experienced employment growth in 2023 except for Cape Breton (-2,500), falling by 4.8%. The unemployment rate for Cape Breton remains the highest province-wide at 11.3%although falling sharply from 15.9% five years previous.
- A disproportionate 86% of job creation in 2023 occurred in the Halifax region which had just over half of total employment (54.4%). Almost 4,000 of the jobs gained in 2023 within this region came from the information, culture, and recreation industry.
- The Annapolis Valley region had the lowest unemployment rate in the province at 5.1% in 2023, remaining stable from 5.2% a year earlier. Jobs have grown by 12.3% compared to five years ago to 63,800 and the region continues to be the primary contributor to agriculture accounting for over a third of jobs in the industry (37.3%).
Show data table
| Employment Change ('000s) | |
|---|---|
| Nova Scotia | 12.9 |
| Halifax | 11.2 |
| North Shore | 1.9 |
| Annapolis Valley | 1.2 |
| Southern | 1.1 |
| Cape Breton | -2.5 |
Download the PDF version (552 KB) of this content.
- Date modified: